Assess Your Positive & Negative impacts

Reveal your societal and environmental footprint with our science-based tool — benchmark your performance against industry averages and peers, just like EBIT.

PI Impact Accounting Framework, Impact Accounting Standard PI Value & Risk Framework, PI Strategy Framework PI Rahmenwerk zur Wirkungsbilanzierung, PI Wert & Risiko Rahmenwerk, PI Strategie Rahmenwerk

The PI Reference Path — a science-based benchmark trajectory — provides:

  • Science-based benchmark values for six topics and 14 indicators
  • A clear trajectory from 2020 to 2050 and beyond
  • Full value-chain coverage — from operations to upstream and downstream impacts
  • Benchmark your performance against peers and industry averages — see exactly where you stand and where to improve
  • CSRD alignment — enabling fact-based, auditable, and legally sound materiality assessments across short-, medium-, and long-term horizons
PI Impact Accounting Framework, Impact Accounting Standard PI Value & Risk Framework, PI Strategy Framework PI Rahmenwerk zur Wirkungsbilanzierung, PI Wert & Risiko Rahmenwerk, PI Strategie Rahmenwerk

our tools empower organizations to

Measure current impacts on
Topics covered by PI's Impact Accounting Framework
benchmark
against industry averages and peers
EXPRESS IMPACTS IN IMPACT POINTS™
comparable across products, companies, sectors, and over time
cross-sectoral
applicable across all industries and value chains
FORECAST future impacts 
based on strategies, trends, and set targets
Identify financial value, risks, and opportunities
tied to your material impacts
ACT with confidence
based on data — not assumptions

Measuring your positive and negative impacts

Built on internationally recognized science and methodologies, the PI Reference Path™ (PRP) enables you to quantify both positive and negative impacts — not just in theory, but in actionable, measurable terms. It covers the issues that matter most: climate, water, biodiversity, health, social, and fiscal impacts.

The PI Reference Path™…

The PI Reference Path™ shows the science-based trajectory toward net positive societal impact by 2050, allowing organizations to measure whether their impacts are positive or negative relative to the benchmark.

The PI Reference Path™ incorporates targets and data from authoritative sources — including IPCC, UNEP, Stockholm Resilience Centre, the UN Sustainable Development Goals, ILO, IMF and the OECD.

Why use the path? Standardization is what makes the tool powerful: it translates global sustainability goals into concrete thresholds for individual organizations — allowing you to track where you are today, forecast future impacts, and act with confidence.

From measuring impacts to steering strategy and financing — the PI tool supports the full sustainability decision cycle.

Intention:

Uncover data gaps and prioritize material impacts across your operations

Challenge:

Incomplete data, e.g., on upstream impacts

Solutions:

> Identify and estimate data gaps across your organization, portfolio, or projects using the KPIs of the PI Reference Path™ and PI’s Advanced Data Modeling. This helpsidentify where estimates should later be replaced with primary data (in conjunction with Supplier Impacts)

> Current Impacts: Understand your current impacts by calculating them in % and Impact Points™ for the most recent year

Intention:

Understand how your suppliers perform compared to each other and the industry average to inform your purchasing strategy

Challenge:

Lack of holistic assessment approaches and incomplete data from your suppliers

Solution:

> Assess supplier impacts in context to guide sourcing decisions and drive supplier performance improvement

Intention:

Understand the downstream and life-cycle impacts of your products and your contributions to them

Challenge:

Lack of holistic life-cycle impact assessment approaches and incomplete downstream data

Solution:

> Assess downstream and product life-cycle impacts using PI-LCIA® & LC-NPI®, enabling product-level impact quantification and informing offering and portfolio strategies, and enabling Impact Points™ communication

Intention:

Understand how you perform compared to peers and industry average

Challenge:

Lack of holistic assessment approaches and incomplete data

Solution:

> Impact benchmarks: Compare your impact performance to industry average and peers with holistic, context-aware benchmarking.

Intention:

Integrate ESG Impacts into your Financial Risk & Opportunity valuation and management

Challenge:

Lack of understanding and ability to quantify ESG&F risks & opportunities

Solutions:

> Quantify ESG-related risks and opportunities to inform strategic decisions and their anticipated sustainability outcomes.

> Strategic actions: Evaluate identified actions on their expected contribution to your Future Impacts as well as to your non-financial and financial targets

Intention:

Set science-based/informed targets for climate and other material impacts

Challenge:

Set context-based targets for climate and other topics (that make sense)

Solutions:

> Integrated target setting: Evaluate how current targets align with science-derived paths using Future Impact Points™ (%, NPI®), benchmarking to inform ambition-setting

> Desired Impact Ambition and Strategic Ambition: Determine the Ambitions for your organization or venture that fits both your business strategy and your risk/opportunity profile

Intention:

Conduct a CSRD-compliant Double Materiality assessment

Challenge:

Lack of clear, science-based thresholds for determining materiality

Solution:

> Use science-based thresholds for objective, CSRD-aligned materiality determination

Intention:

Integrate ESG into Business Strategy, Model and Processes

Challenge:

Lack of standardized approaches that fit different business strategies and models

Solution:

> Integrated decision-making: Use Impact Ambition levels to drive ESG integration across your business strategy and operations

Intention:

Integrate material Impacts, Risks & Opportunities (IROs) into reporting and communication

Challenge:

Pinpointing which Impacts are truly material — the ones that drive Risks and Opportunities

Solution:

> Use science-based impact quantification to identify material Impacts, enabling proper risk & opportunity assessment, clear strategy definition, and compliant reporting.

Intention:

Monitor the contribution of activities to manage Impacts, Risks & Opportunities (IROs)

Challenge:

Lack of methods to monitor the contribution of actions

Solution:

> Track how your actions affect sustainability performance and both financial and non-financial targets over time

Intention:

Communicate sustainability performance clearly using Impact Points™ and product-level impact insights.

Challenge:

Presenting complex sustainability performance information in a concise, compelling manner

Solution:

> Communicate your sustainability performance clearly and convincingly to customers

Intention:

Demonstrate ESG value to reduce cost of capital and unlock sustainability-linked financing

Challenge:

Lack of holistic, context-based ESG Impacts valuations of Investments

Solution:

> Demonstrate ESG value to reduce cost of capital or unlock green finance through evidence-based impact valuation

Contact us to see how we can help you with your specific situation

Impacts are no longer abstract – they’re measurable

Regulations are evolving, stakeholders are watching, and climate urgency is real. Knowing your impacts isn’t just smart — it’s essential. Yet most tools stop at vague, qualitative insights that don’t drive decisions. Our Impact Accounting Framework and Tool changes that without impact washing the results.

Whatever your sector or size, you gain a clear and comparable picture of where you stand, what’s required, and the path to positive impacts — turning impact data into real strategic action.

Indicators

The PI Reference Path™ (PRP) for climate enables science-based measurement and benchmarking of positive and negative climate impacts.
The PI Reference Path™ (PRP) for water enables science-based measurement and benchmarking of positive and negative water impacts.
The PI Reference Path™ (PRP) for biodiversity enables science-based measurement and benchmarking of positive and negative biodiversity impacts.
The PI Reference Path™ (PRP) for health enables science-based measurement and benchmarking of positive and negative health impacts.
The PI Reference Path™ (PRP) for social matters enables science-based measurement and benchmarking of positive and negative social impacts.
The PI Reference Path™ (PRP) for fiscal contributions enables science-based measurement and benchmarking of positive and negative fiscal impacts.

Our tool assesses both current and future impacts — across climate, water, biodiversity, health, social, and fiscal.

  • Current impacts show the actual effects of your organization in recent years
  • Future impacts project expected performance based on trends, targets, and planned actions

All impacts are first quantified — in absolute values, percentages, or Impact Points™ — and then translated into clear impact performance levels, making complex impact data understandable, actionable, and easy to benchmark.

PI's 4 Impact KPIs: Together, these four KPIs show current performance, future performance, timing gaps, and climate pressure.

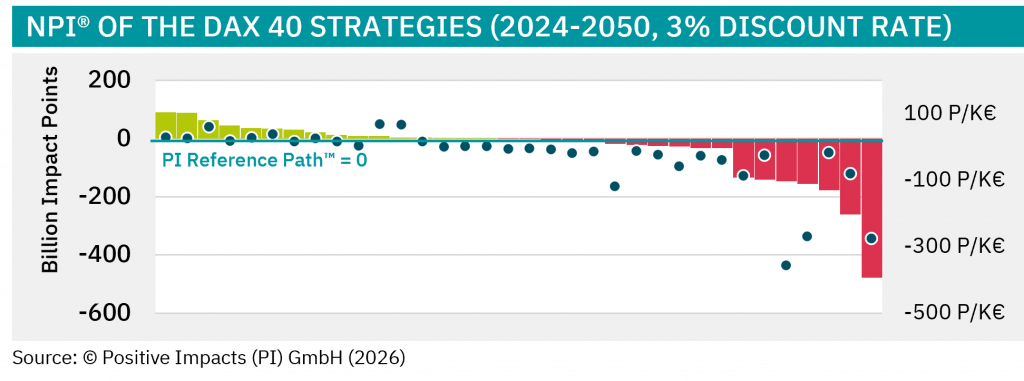
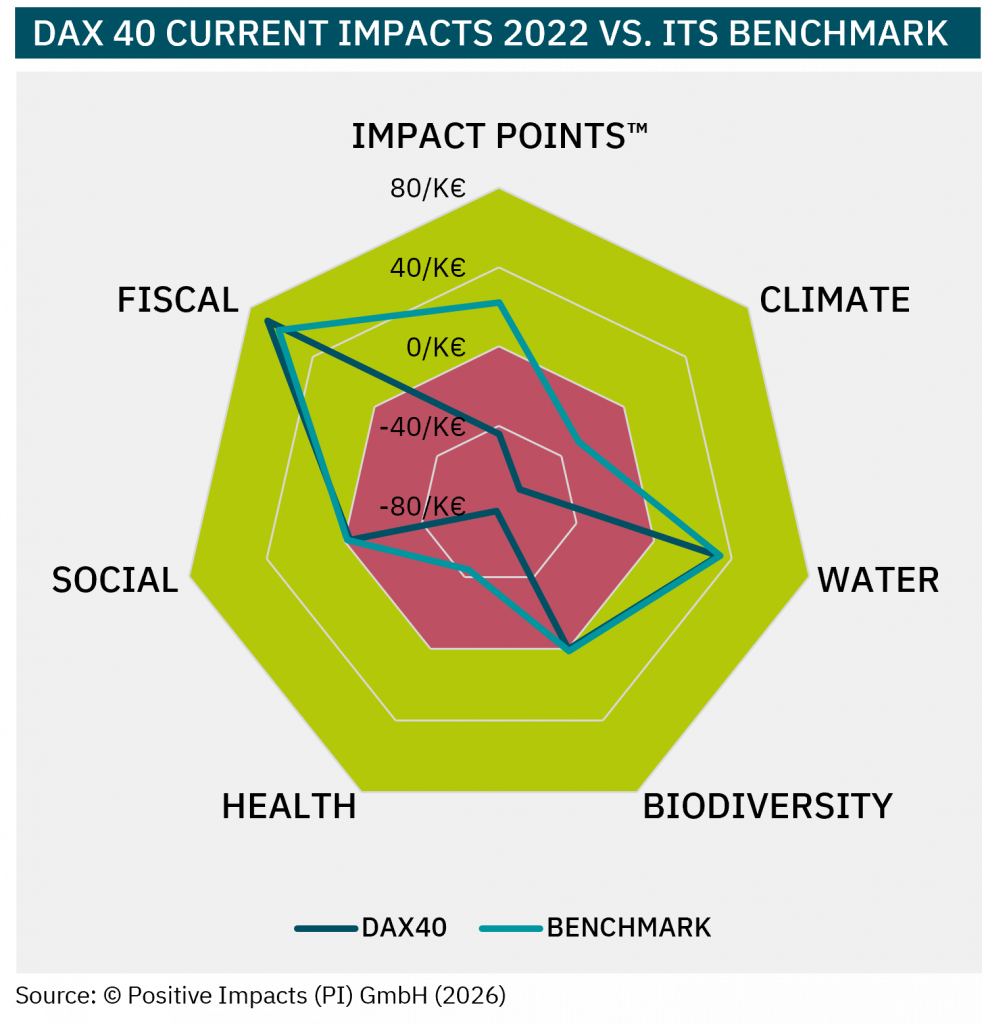
CURRENT IMPACTS of your organization — in % and Points/K€

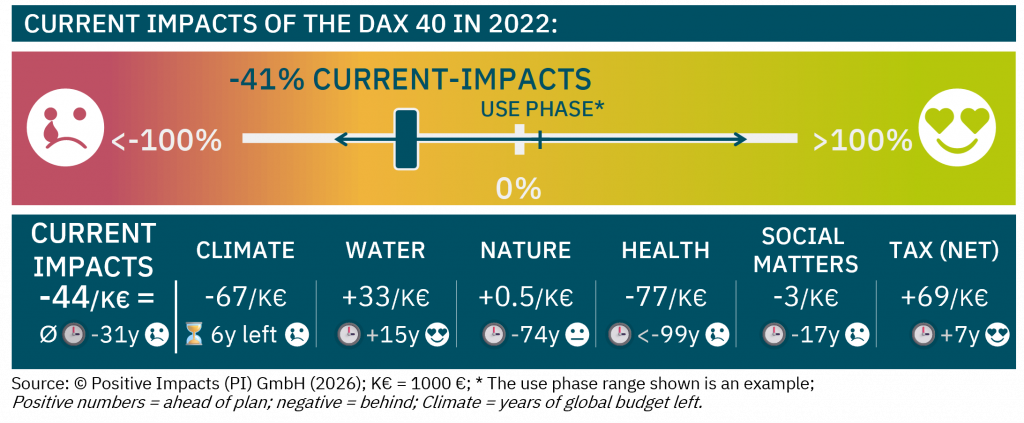
Current impacts show how your organization is performing today compared to the expected level for the current year — both in percentage and Impact Points™.

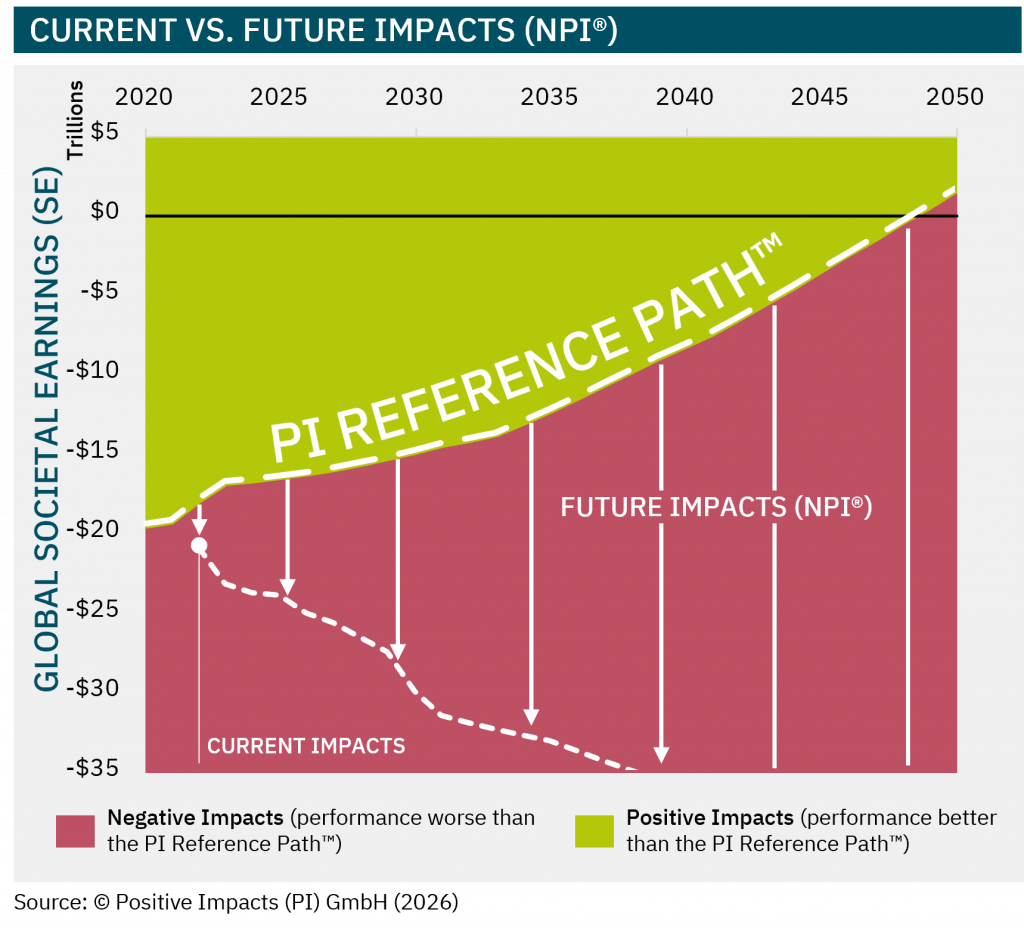
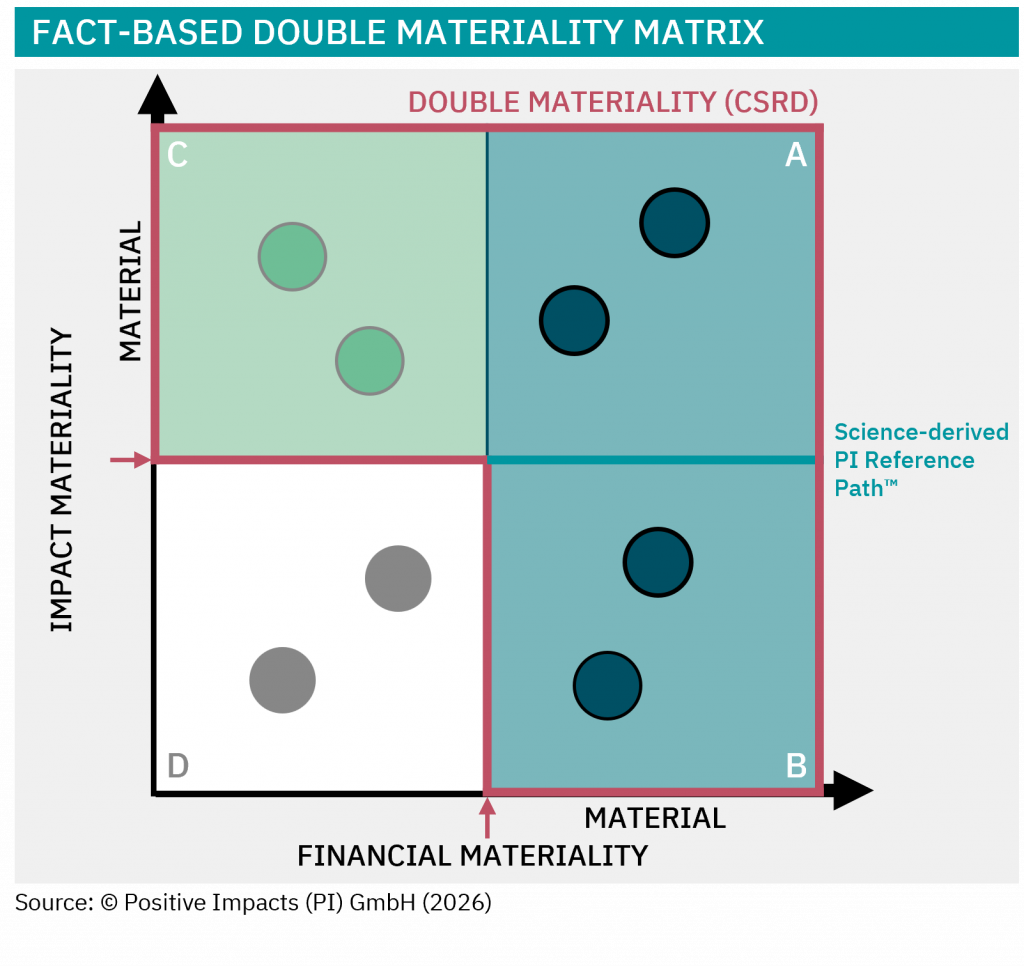
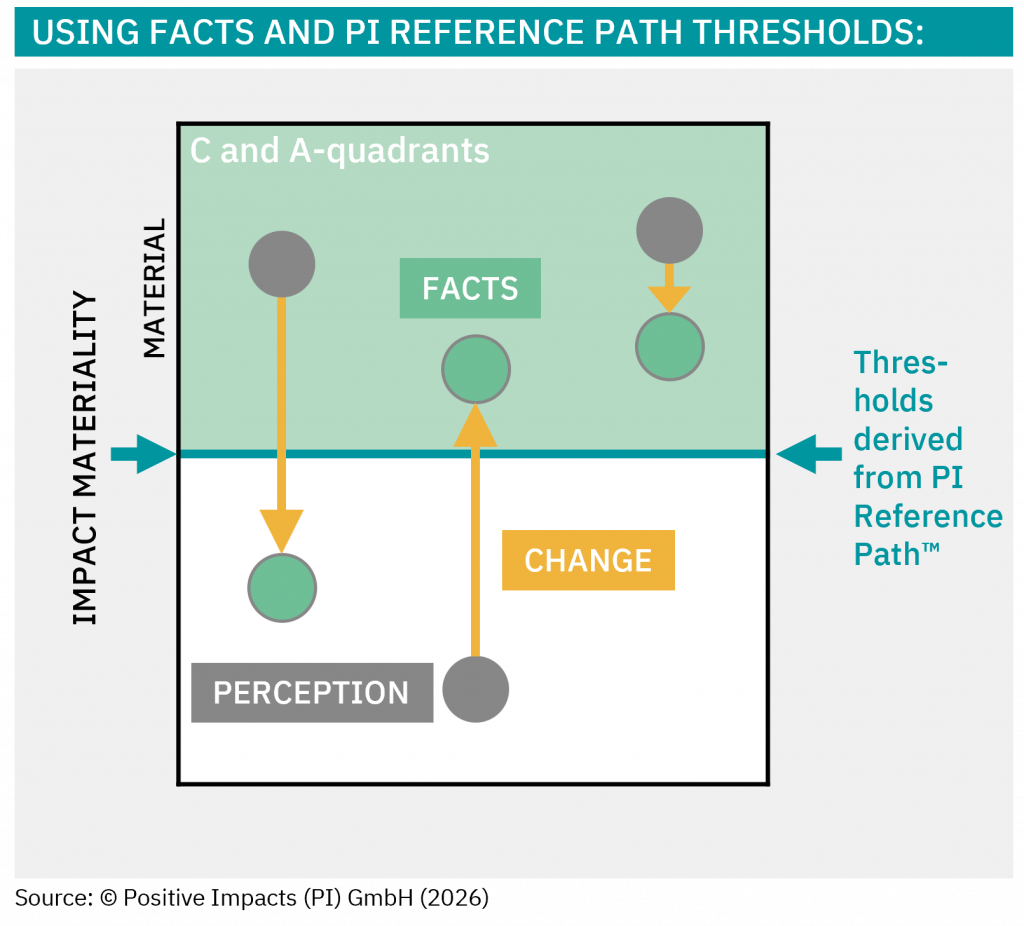
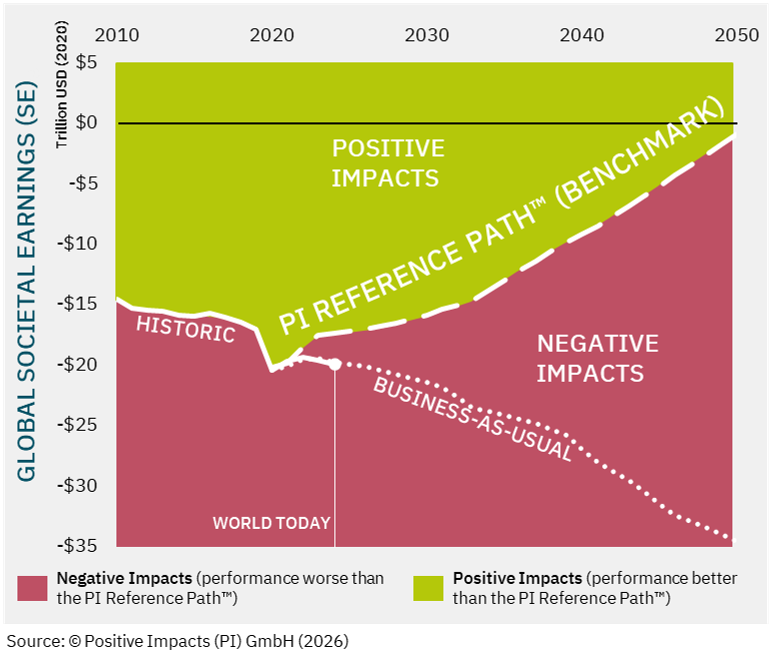
They quantify how close your current operations are to full alignment with the PI Reference Path™. They:

  • Express performance as a percentage (−X % to +X %) and in Impact Points™ (shown here as Points/K€), where 0 = full alignment
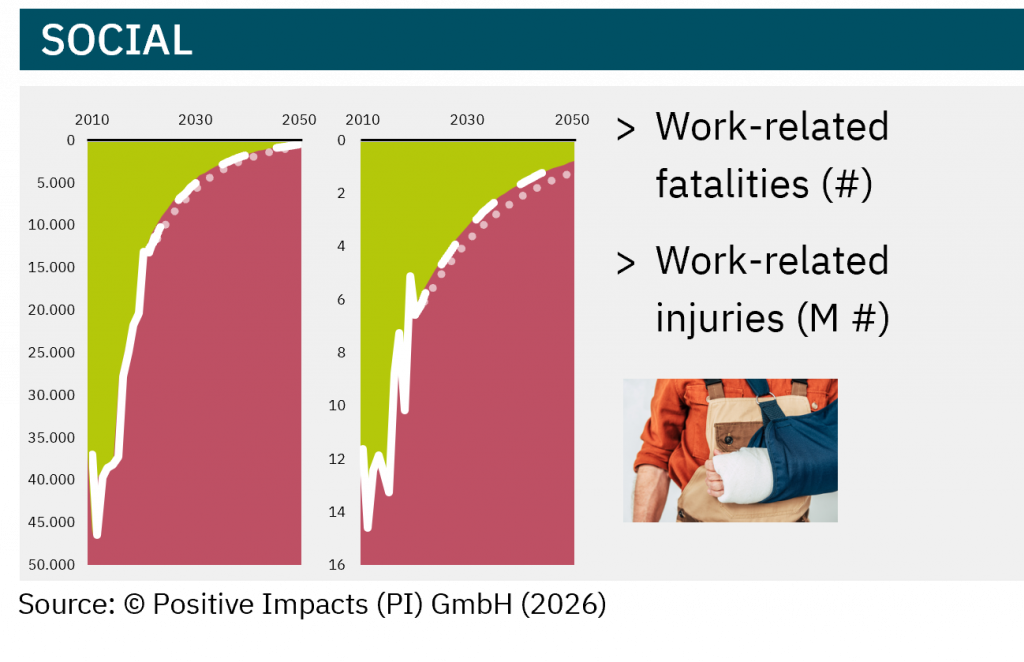
  • Weight impacts by their severity, so more significant outcomes (e.g. a fatality vs. an injury) carry greater influence
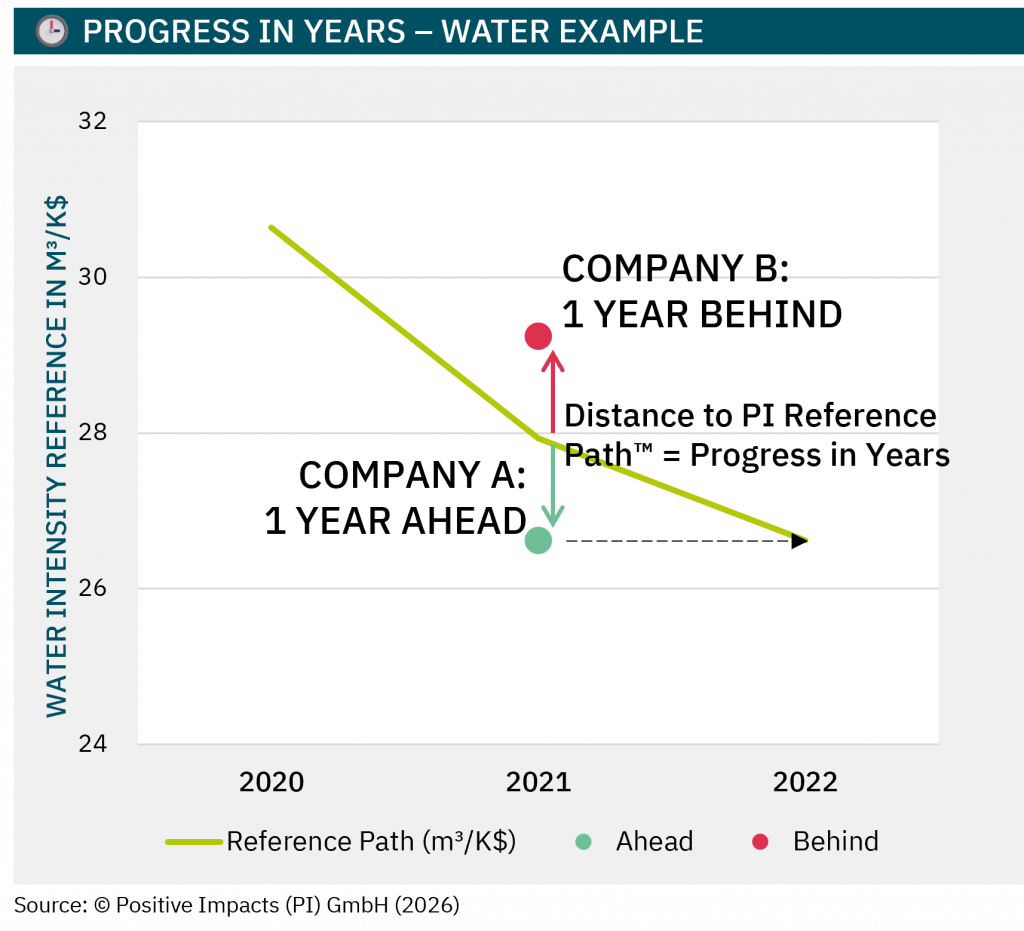
  • Translate impact gaps into time — “Progress Years” show how many target-years performance is ahead or behind (see next tabs)
  • Highlight strengths and gaps, helping you prioritize what matters most
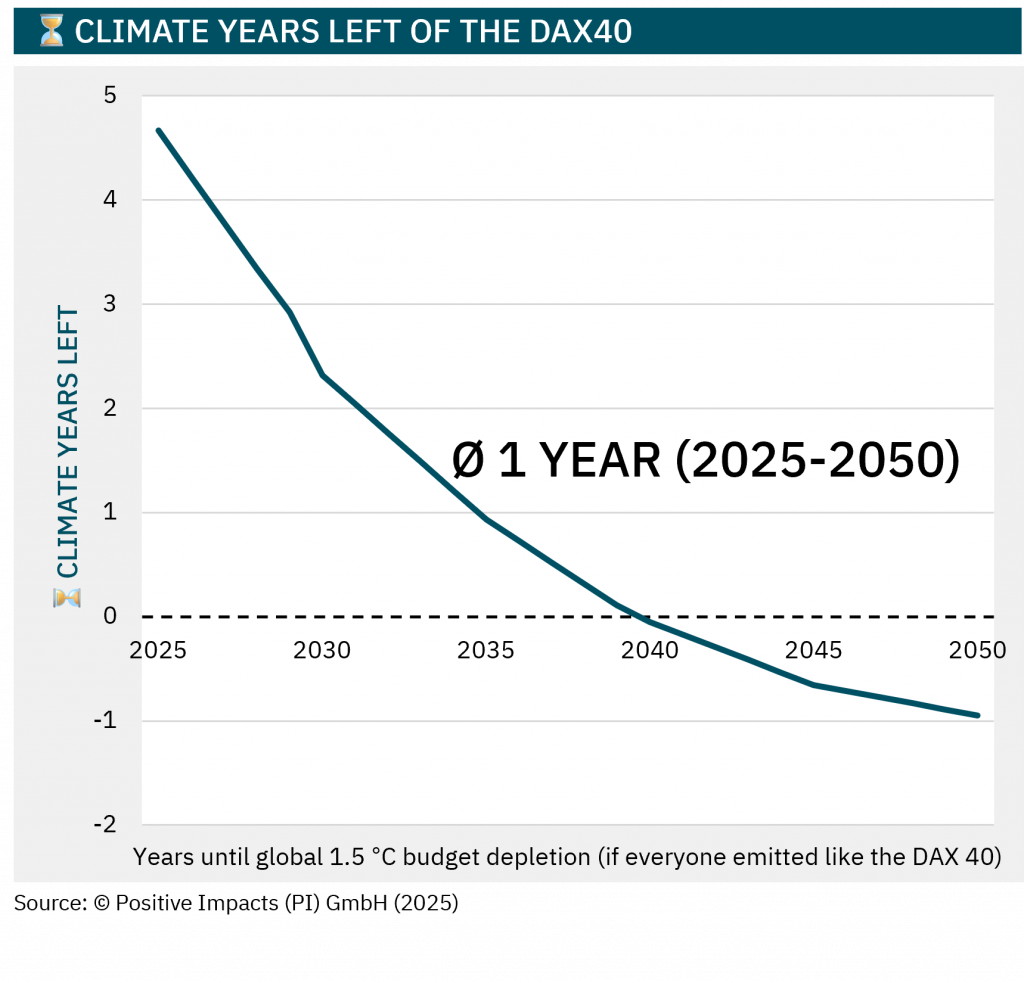
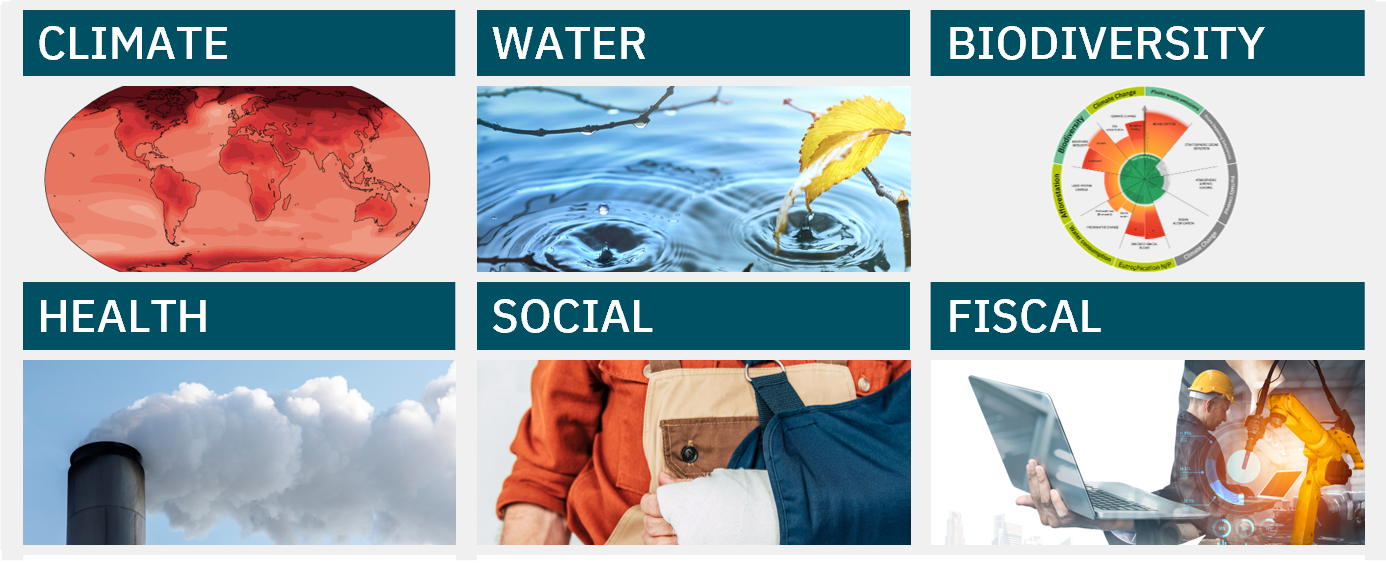
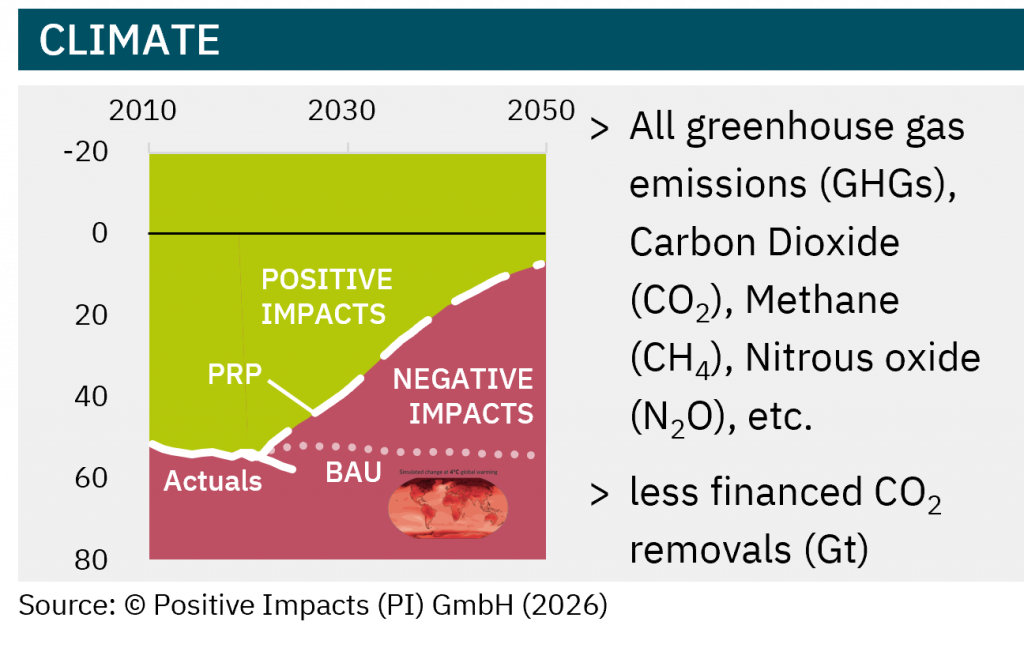
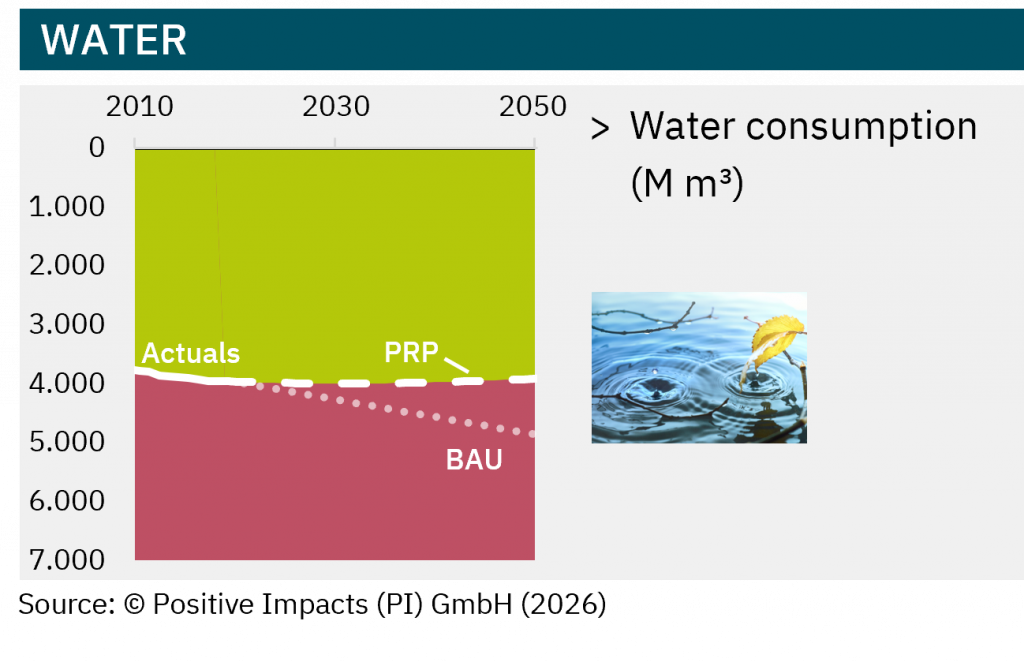
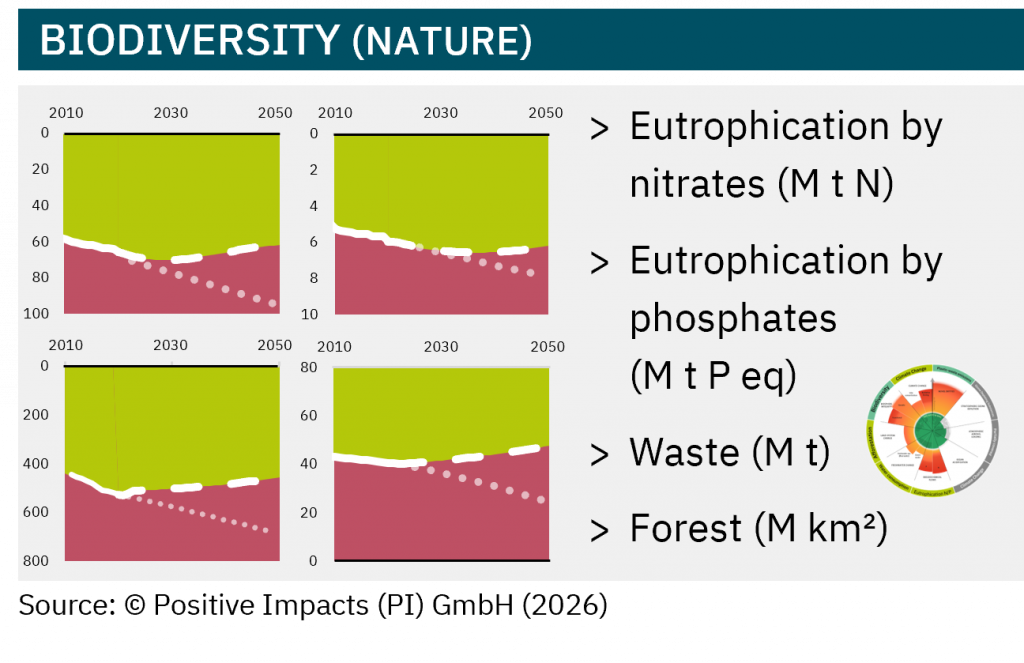
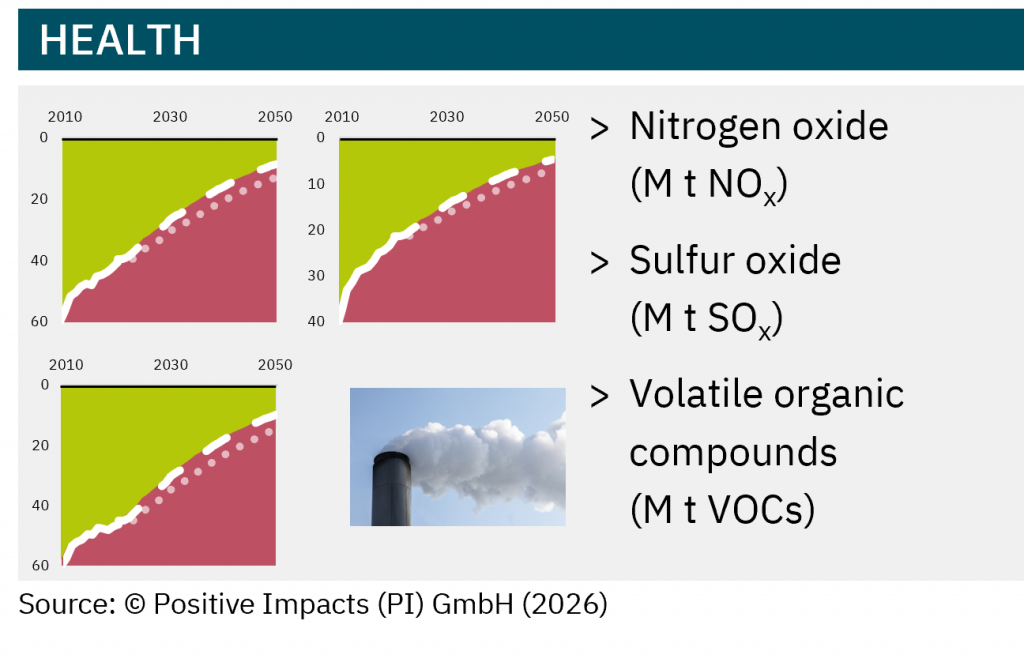
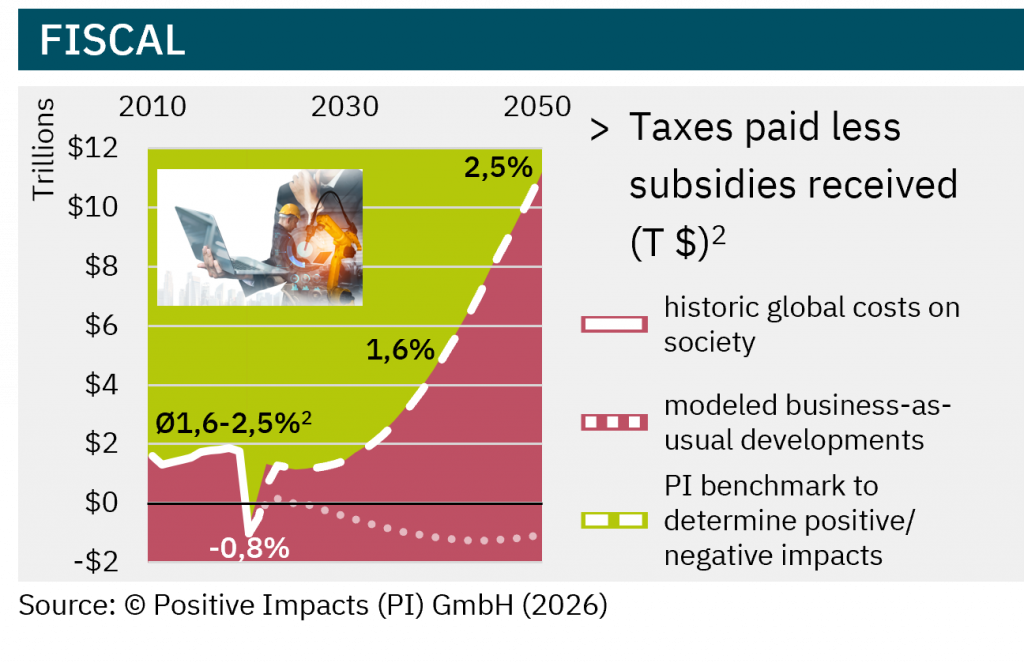
  • Aggregate results across six topics: climate, water, biodiversity, health, social, and fiscal
  • Enable benchmarking across sectors, activities, products, and value chains
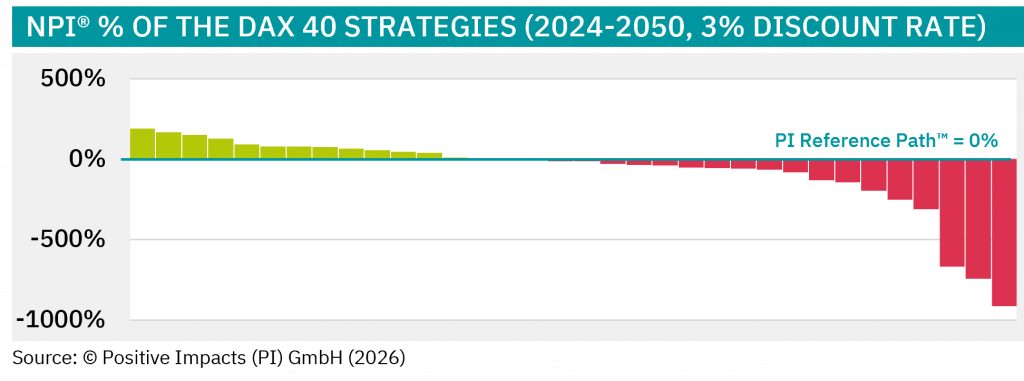
  • Uses an open-ended scale capturing both positive and negative net impacts

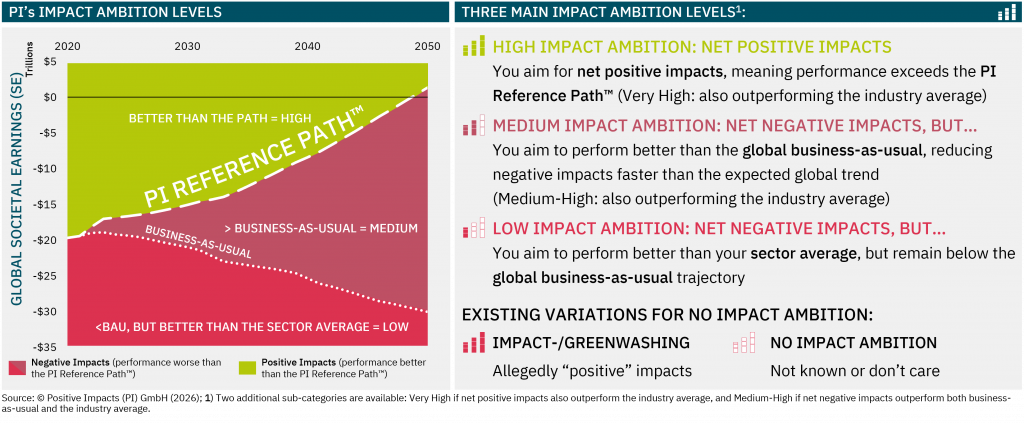
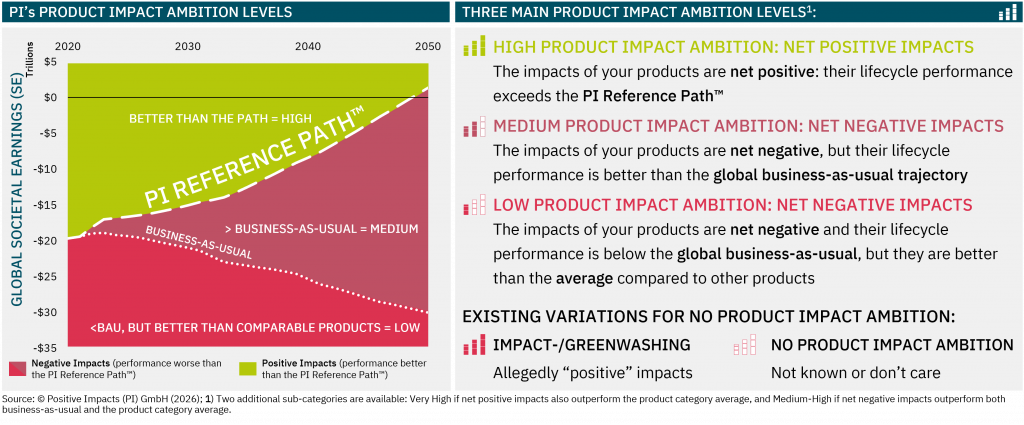
After quantifying Current Impacts, your sustainability performance is classified into three main Impact Performance Categories high, medium, or low — with two optional sub-categories (very high and medium-high) for more granular assessment.

These impact performance categories reveal how your organization compares to the PI Reference Path™ and to the global average, showing at a glance whether you are leading, aligned, or falling behind.

The CURRENT Impacts of the DAX 40 show overall negative impacts of -44 Impact Points/K€ revenue (-41%), covering operations + upstream for all indicators of the six topics while estimating missing data to ensure a complete picture

Climate Years left – for both current and future impacts

Climate Years Left shows how many years remain until the global 1.5 °C carbon budget would be used up — turning emissions into time. It:

  • Answers the question: How many years remain until the global GHG budget for limiting warming to 1.5 °C is used up if everyone had the same GHG emissions as your organization, or product?
  • Can be calculated for current impacts (if today’s emissions stayed constant) or for future impacts (based on projected trends and targets).
  • If global emissions stay at today’s level, the world would exhaust the 1.5 °C budget in ~12.4 years.

This KPI complements our Impact KPIs — showing how emissions translate into time left within the global 1.5 °C budget.

The Climate Years Left KPI translates corporate emissions into time left within the global 1.5 °C budget. The DAX 40 average from 2025 to 2050 is ≈ 1 year. The PI Impact Accounting Framework, Das PI Rahmenwerk zur Wirkungsbilanzierung

Progress in Years – how far current and future impacts are ahead or behind the reference path

Progress in Years shows how many target-years performance is ahead or behind plan — turning impact gaps into time.

Progress in Years — for current and future impacts

  • Current Impacts (Progress in Years):
    Show how far each indicator’s current performance is ahead or behind its annual target — expressed in target-years.
    Positive = ahead of time, negative = behind.
    The overall result combines all indicators into a single weighted average of Progress Years, using their impact magnitude (Points/K€) as weights.
    It shows how far the organization, overall, is ahead or behind sustainability targets in time.
  • Future Impacts (Progress in Years):
    Show the average time gap between projected performance and the target path over the forecast horizon (e.g., 2025–2050).
    Calculated as a simple, un-discounted average of annual Progress Years:
    positive = ahead, negative = behind.

Together, these KPIs complement our Impact KPIs — translating performance and alignment gaps into time.

FUTURE IMPACTS (NPI®) — in % and Impact Points™

Net Present Impact® (NPI®) is a forward-looking KPI that projects your organization’s future impacts and expresses them in both percentage and Impact Points™, discounted to today.
Similar to Net Present Value (NPV), it gives greater weight to near-term actions and less to distant targets without clear milestones. It:

  • Discounts future impacts (e.g. 2025–2050) to present values, aligning them with the PI Reference Path™
  • Expresses results in percentage (−X % to +X %) and Impact Points™ (Points/K€), where 0 = full alignment
  • Weights outcomes over time, rewarding consistent near-term progress and realistic long-term goals
  • Enables benchmarking across sectors, activities, products, and value chains
  • Supports target management — benchmarking ambitions, identifying gaps, and setting Impact Ambition levels (High / Medium / Low)
  • Uses an open-ended scale, capturing both positive and negative net impacts

By translating long-term performance into both time-weighted percentages and discounted Impact Points™, the NPI® provides a credible and comparable view of expected future impacts — creating a clear bridge between sustainability performance and financial decision-making.

Future Impacts (NPI®) in % are calculated by dividing the Net Present Impact (NPI®) by the expected impacts under the PI Reference Path™ (PRP) over the same period.
Future Impacts (NPI®) in Impact Points™ are calculated by subtracting the expected impacts under the PI Reference Path™ (PRP) from projected future impacts over the analysis period. If projected impacts are better than the reference path, the result is positive; if projected impacts are worse, the resulting Net Present Impact (NPI®) value is negative.
Impact ambition levels

Once Current and Future Impacts are quantified, results are classified into three main Impact Ambition Levels — High, Medium, or Low.

This makes it possible to measure, compare, and align your organization’s activities with the ambition level you aim for, providing a clear benchmark for strategy and performance.

In addition, the Product Impact Ambition Levels complement the approach, if downstream impacts matter to your business model.

Three main Impact Ambition Levels:High Impact Ambition: your impacts are net positive and your performance exceeds the PI Reference Path™ (Very High: also outperforming the industry average).Medium Impact Ambition: your impacts are net negative, but your performance improves faster than the global business-as-usual trajectory (Medium-High: also outperforming the industry average).Low Impact Ambition: your impacts remain net negative and your performance is below the global business-as-usual trajectory, but still better than the sector average. Existing variations for no Impact Ambition:Impact-/Greenwashing: allegedly “positive” impacts.No Impact Ambition: impacts are not known or not considered.

How We Help You Measure and Improve Your Impacts

Chart comparing current impacts with projected future impacts relative to the PI Reference Path™ from 2020 to 2050. The green area above the path represents positive impacts (performance better than the PI Reference Path™), while the red area below represents negative impacts. A dashed white line shows current impacts declining below the reference path. Vertical arrows illustrate the gap between projected impacts and the PI Reference Path™, representing Future Impacts (NPI®).

Measure & quantify impacts — today and in the future

We measure your current and/or future impacts as an organization and compare them against global sustainability targets using the the PI Reference Path™ to determine whether they are positive or negative.

Benchmarking and Performance Tracking

We help you measure and compare your impacts against industry averages and peers, enabling you to align your impact ambition.

Radar chart comparing the DAX 40’s current impacts in 2022 with a benchmark across six topics: climate, water, biodiversity, health, social, and fiscal. Impact performance is shown in Impact Points™ (Points/K€), where positive values indicate performance better than the PI Reference Path™ (green area) and negative values indicate worse performance (red area). Two lines represent the DAX 40 average and the benchmark, highlighting where the DAX 40 performs better or worse across the six impact categories.
Positive Impacts PI Training Workshop Impact Value Strategy Impact Accounting Framework Rahmenwerk zur Wirkungsbilanzierung

Capacity Building and Training

We provide workshops and training sessions to equip your team with the knowledge and skills necessary to implement and sustain impact initiatives effectively.

Strategic Planning for Impact

Our team collaborates with you to develop actionable strategies that integrate the quantified impacts into your organizational goals and build transition plans that fit.

PI Impact Accounting Framework, Impact Accounting Standard PI Value & Risk Framework, PI Strategy Framework PI Rahmenwerk zur Wirkungsbilanzierung, PI Wert & Risiko Rahmenwerk, PI Strategie Rahmenwerk

Impact Reporting and Communication

We support you in transparently reporting your impacts to stakeholders, enhancing credibility and trust.

Impact Materiality made measurable

Impact Materiality assessments form the foundation of effective sustainability strategy and governance. We combine quantitative approaches with feasible stakeholder input to assess the positive and negative impacts of your organization on society and the environment.

Our fact-based double materiality matrix shows how we can apply our science-based thresholds onto any impact materiality scale, giving you clear objective results on your impact material topics (C and A) as well as a fact-based process to determine your financial material topics (A and B).

This ensures that your impact materiality assessment is not just compliant but meaningful. It helps you prioritize actions, allocate resources, and communicate with confidence.

Under CSRD, both missing material impacts and reporting immaterial topics is non-compliant. We help you get it right – what to focus on – and go beyond.