Intention: Actively monitor and manage sustainability/ESG impacts, risks, and opportunities (i.e., ongoing sustainability/ESG data management)
Challenge: Accessing reliable and up-to-date sustainability/ESG impacts data of your portfolio
Solutions:
In case your existing portfolio needs to be assessed:
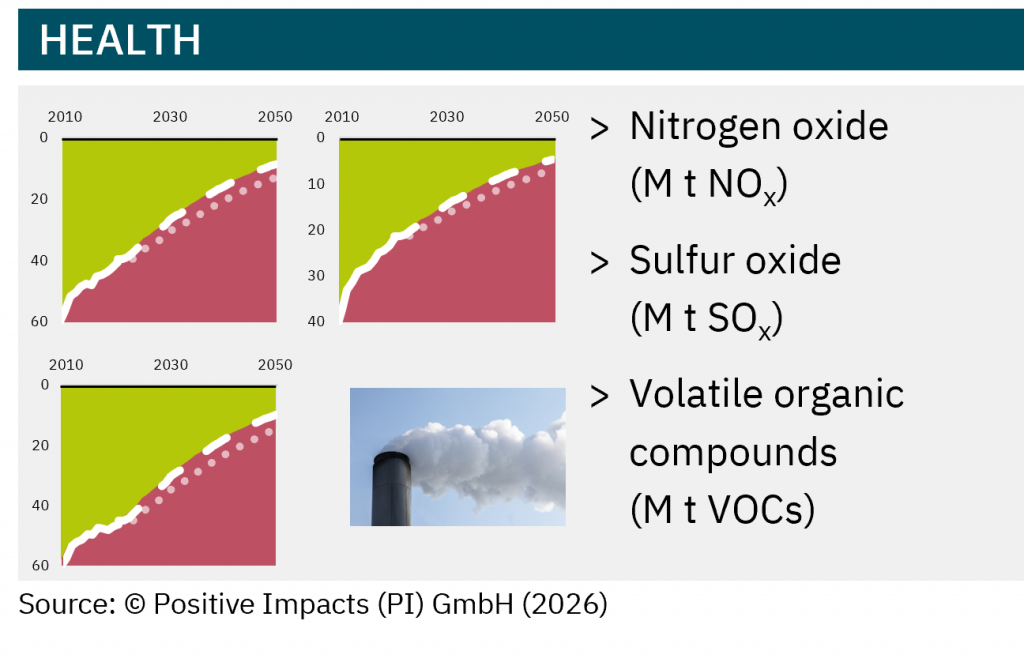
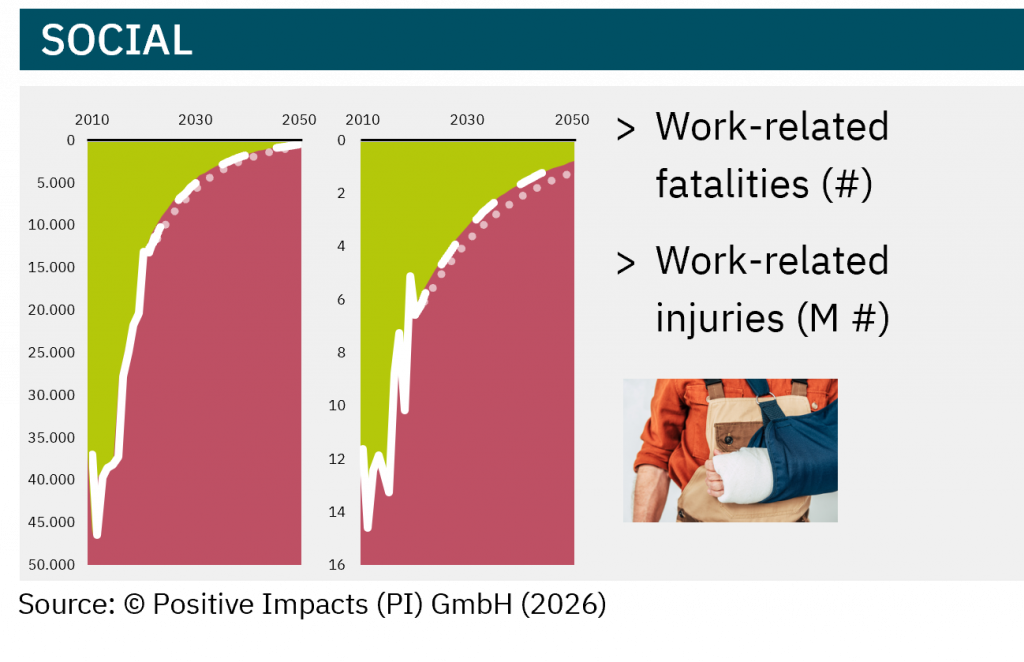
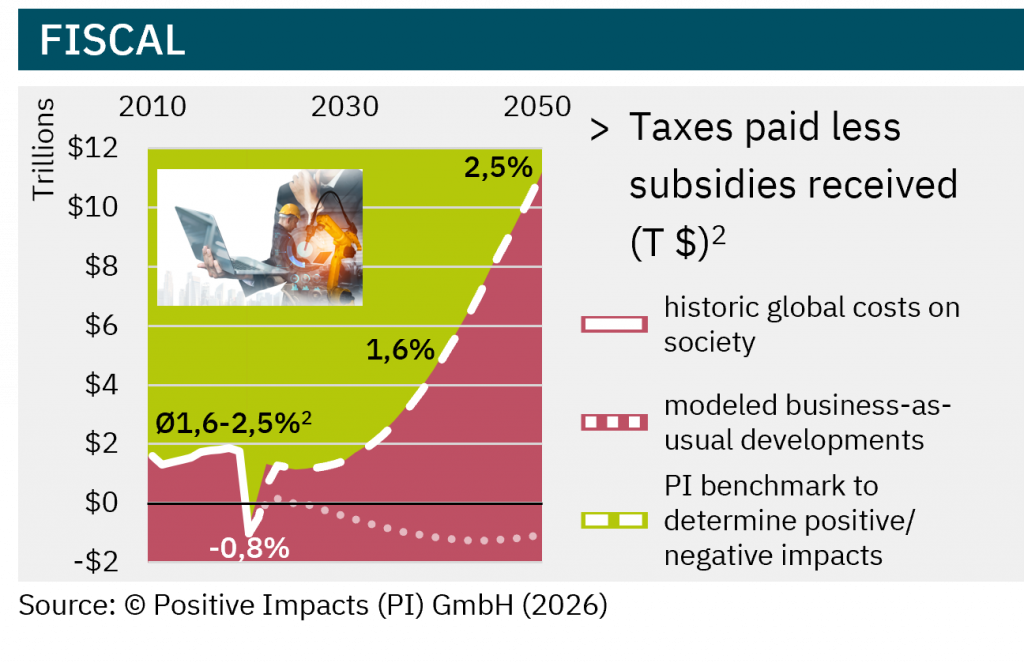
> High-level Impacts-Level Forecast for portfolio industries:
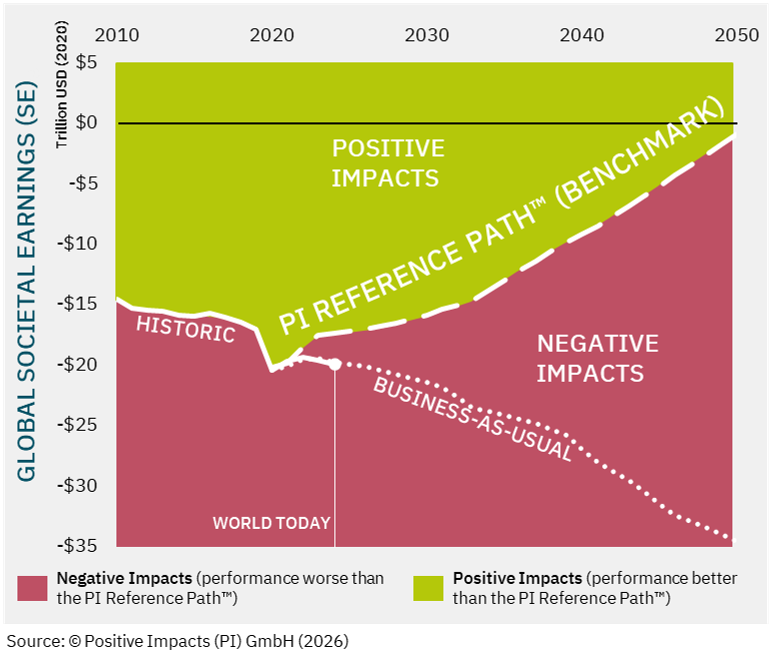
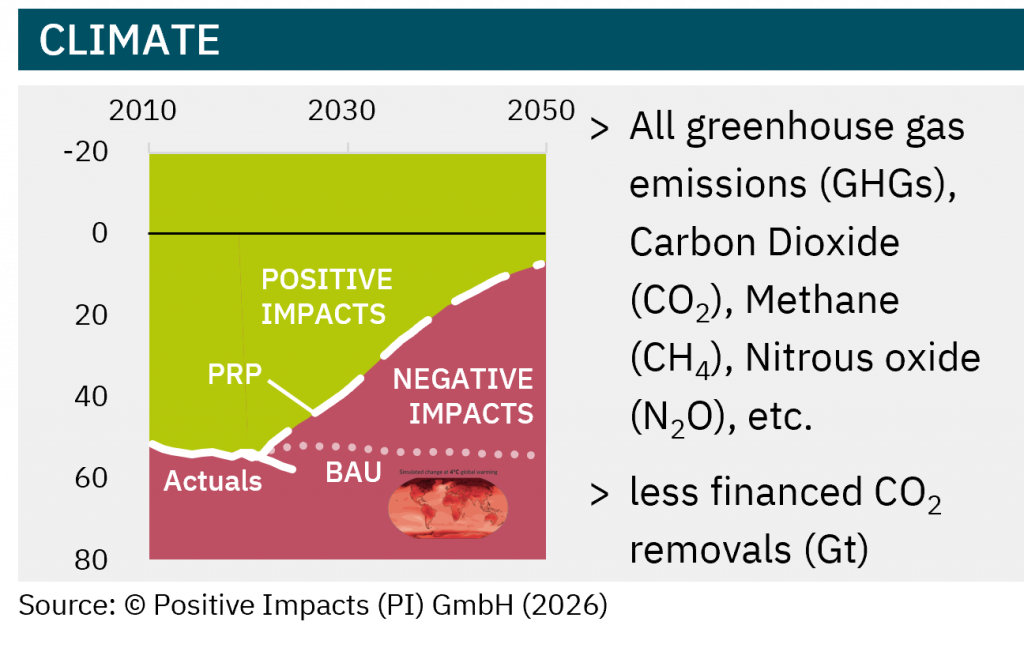
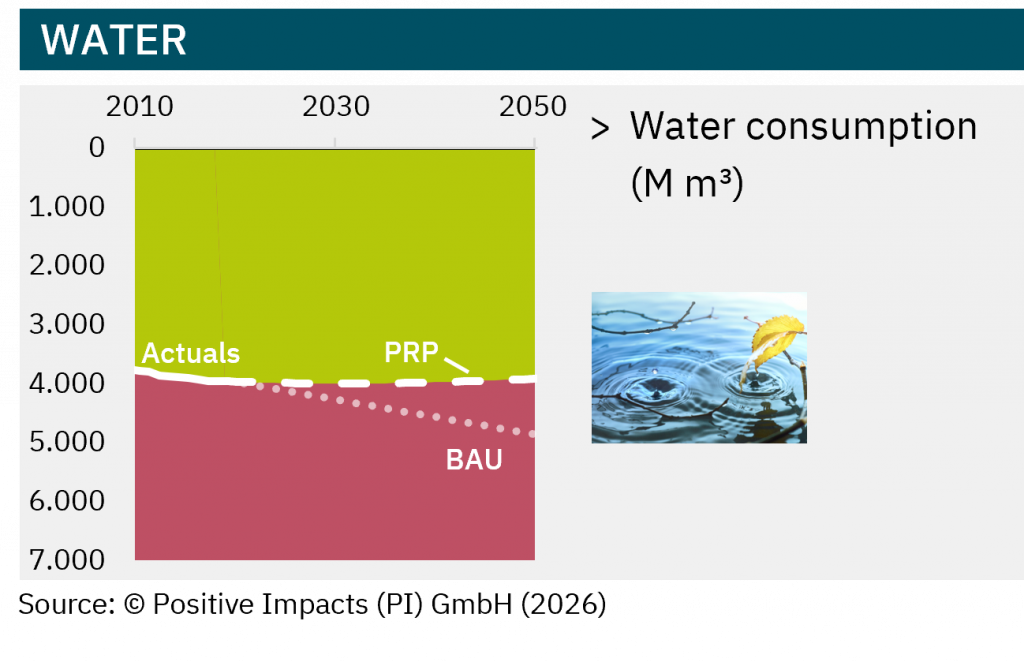
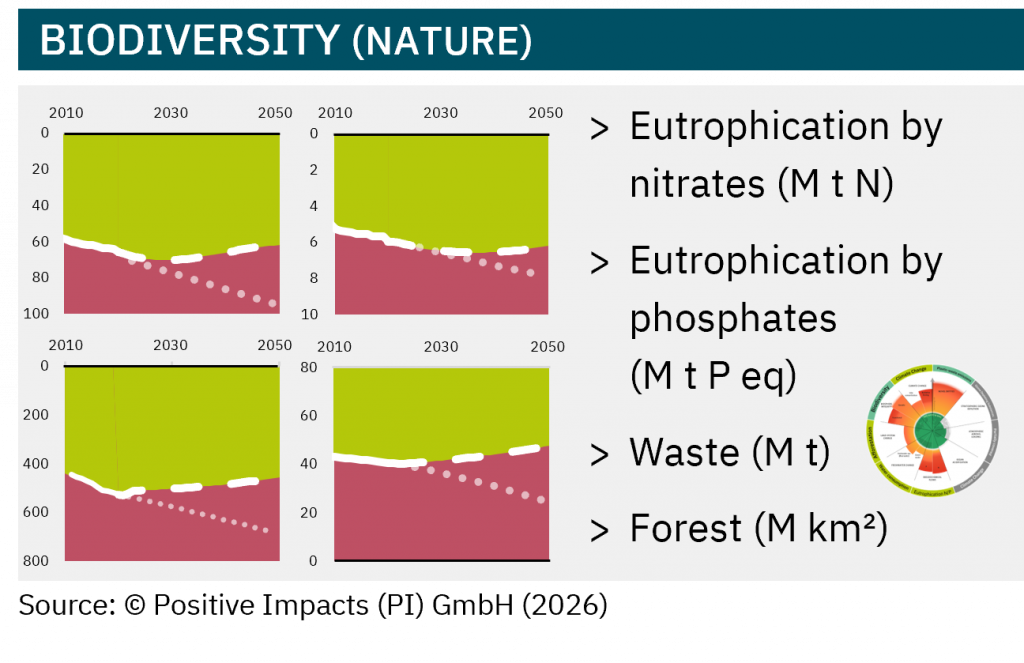
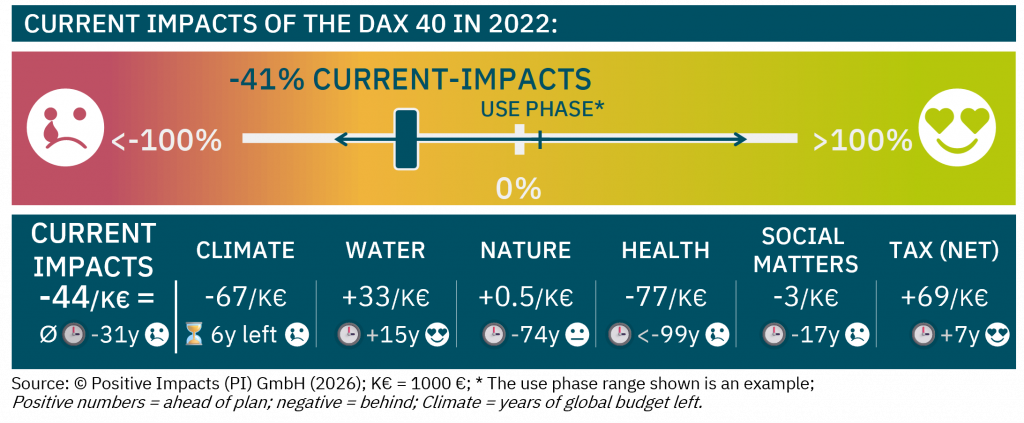
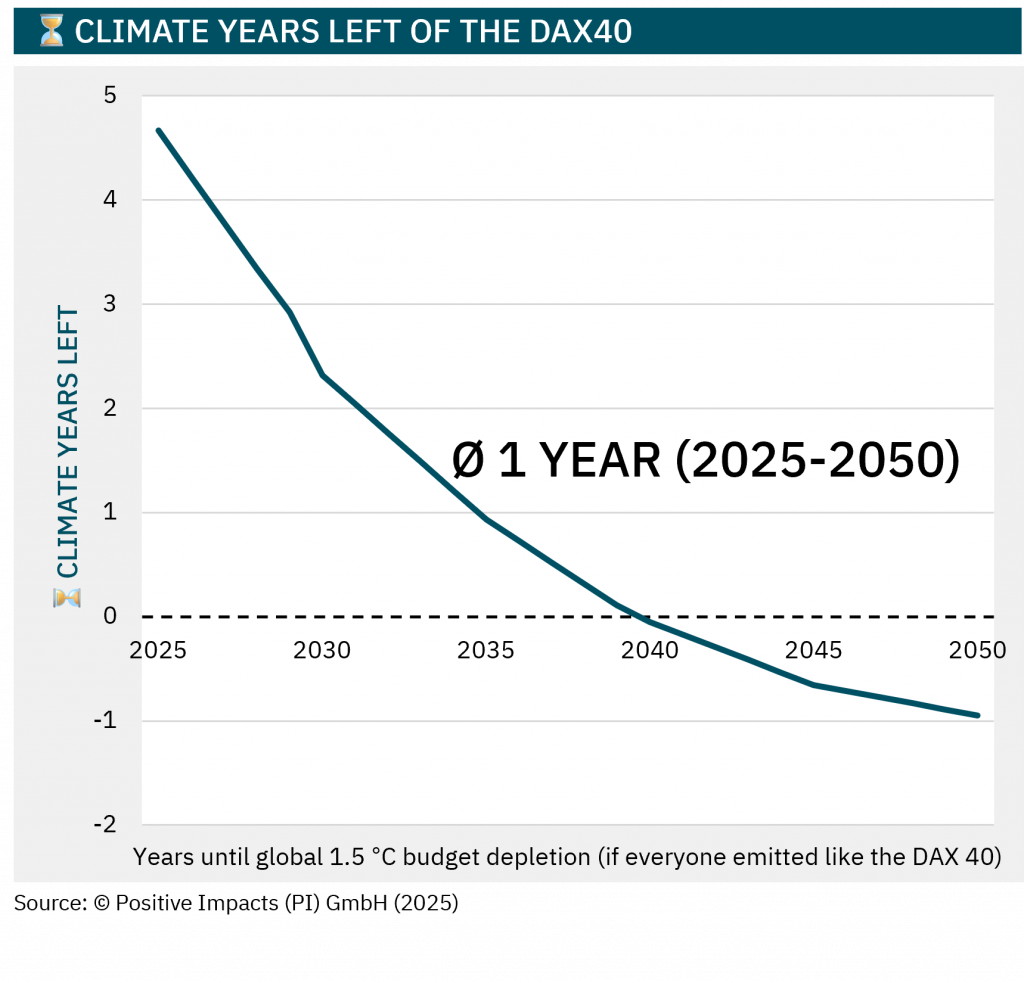
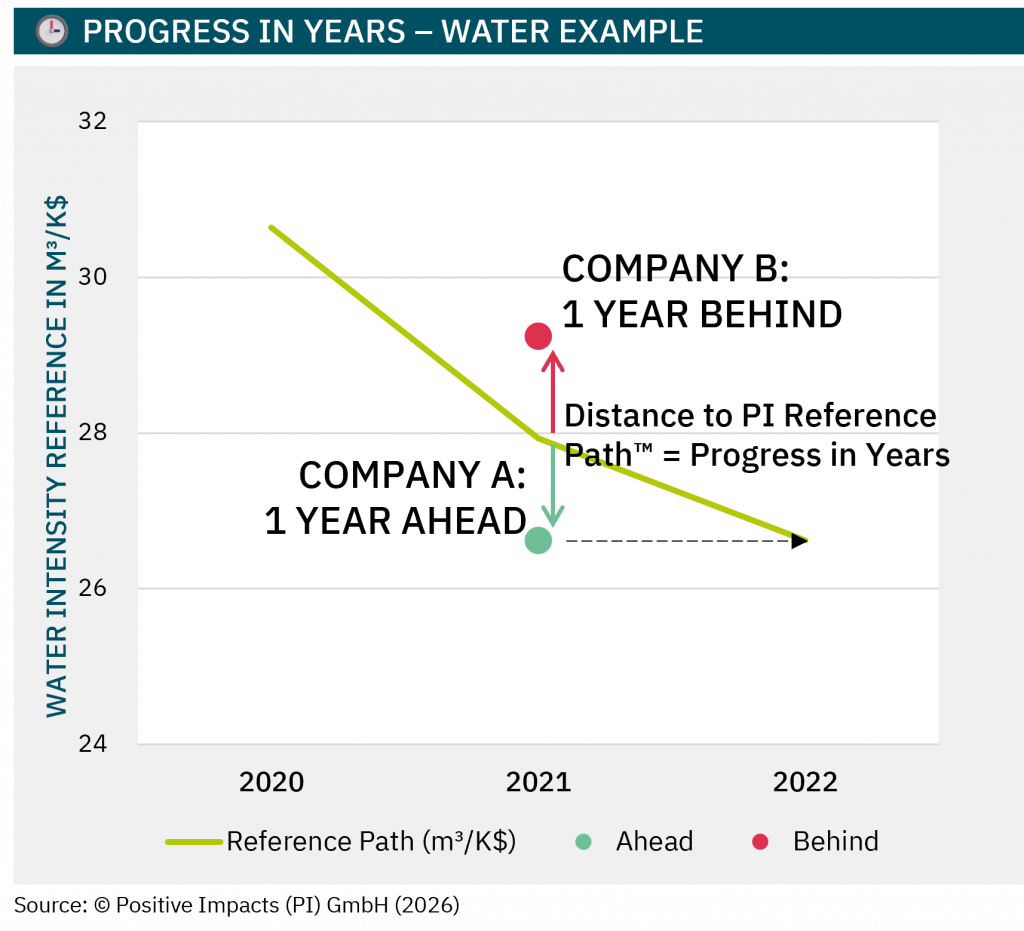
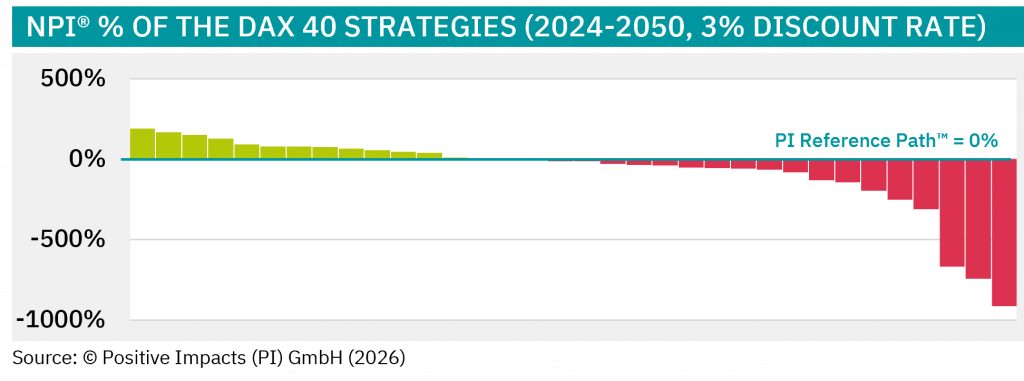
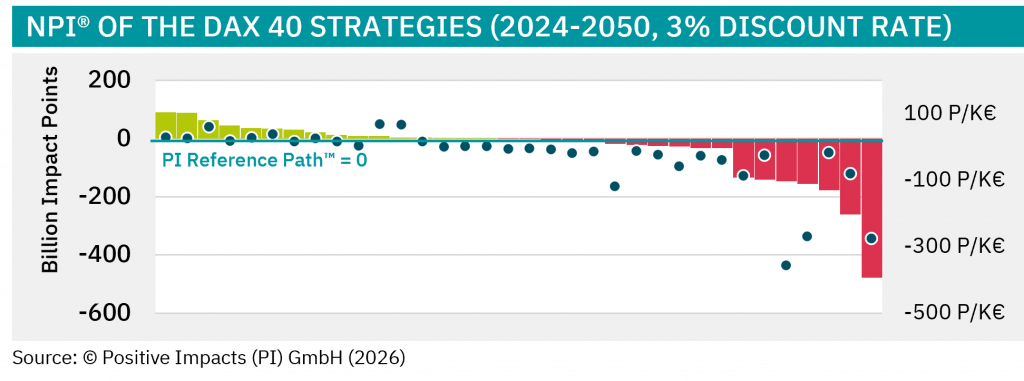
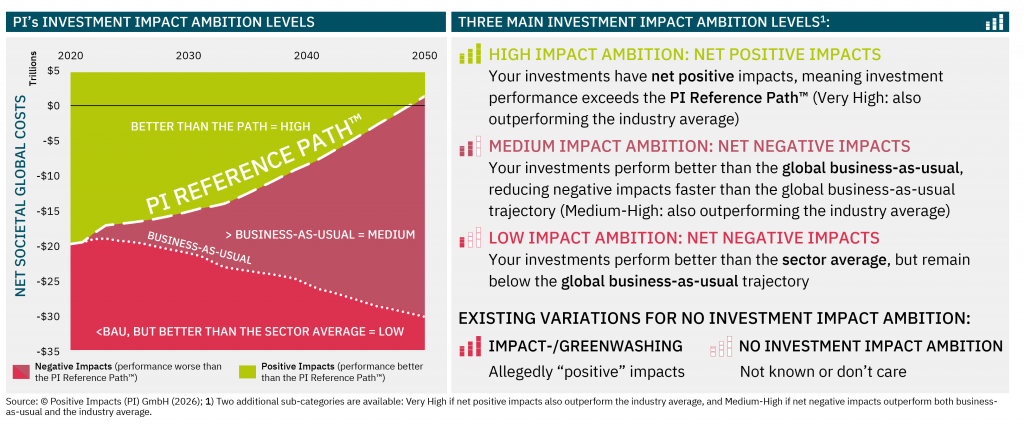
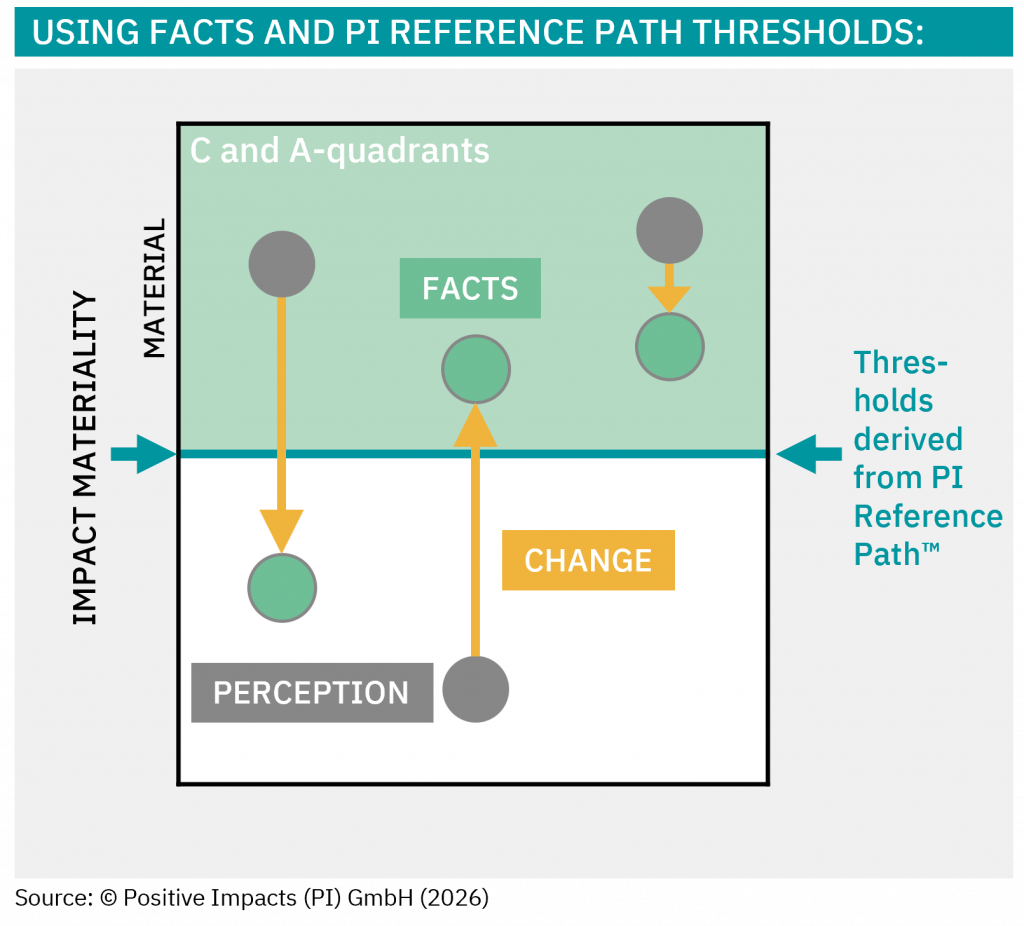
> Evaluate portfolio industries’ current and forecasted Impacts-Levels based on trends of your portfolio and understand how much they are ‘on track’ compared to science-based targets (i.e., the PI Reference Path™) and industry averages, by using the Impacts-Level for the current and the Net Present Impact® (NPI®) for the projected Impacts Levels in % or Points
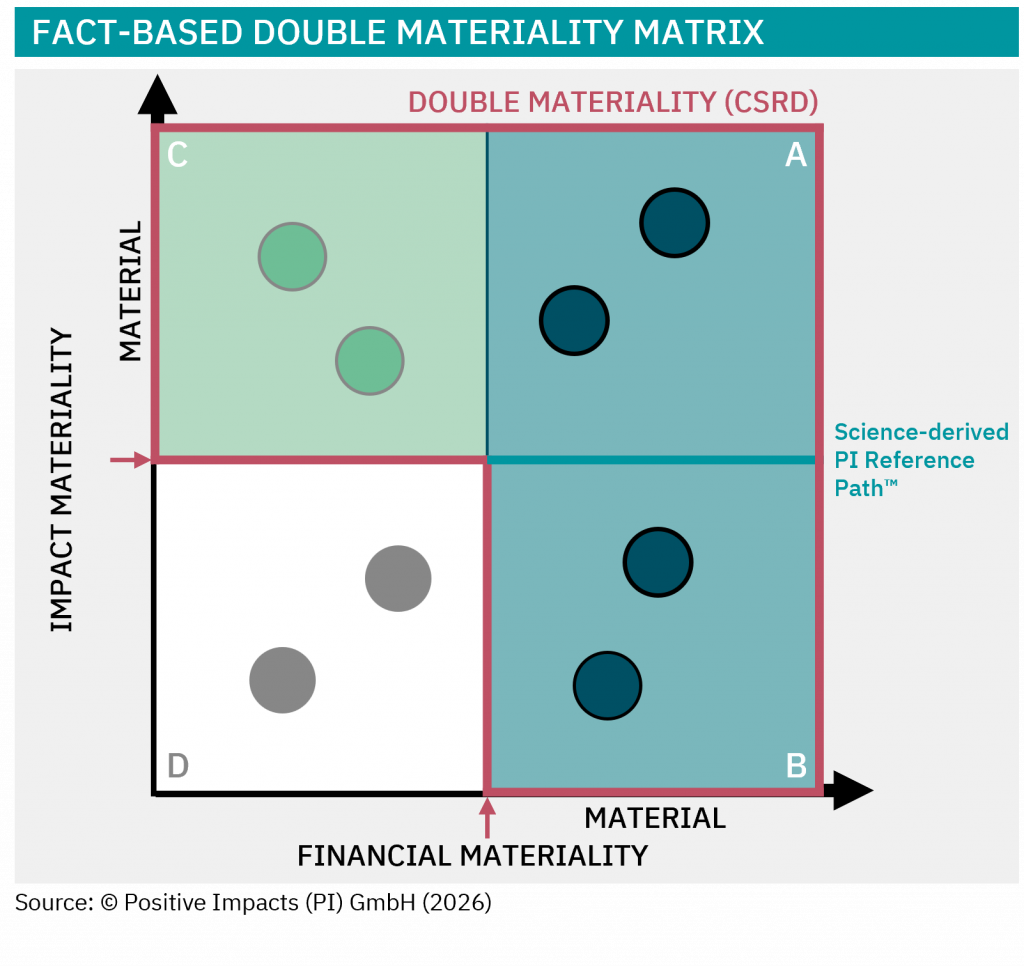
> Identify potential risks and opportunities and industries to be assessed further in the PI® Strategy Matrix
> Detailed Impacts-Level Forecast for individual assets:
> Update the forecasted Impacts-Levels of selected portfolio companies based on existing plans, targets, and trends and understand how much selected portfolio companies are ‘on track’ compared to science-based targets (i.e. the PI Reference Path™), by updating the Impacts-Level for the current and the Net Present Impact® (NPI®) for the projected Impacts-Levels in % or Points
> Identify or validate risks and opportunities and determine investment and engagement strategies in the PI® Strategy Matrix
> Perform Impacts-Level Benchmarks to compare investees’ performance across sectors and against peers (to identify investment opportunities and engagement strategies)
In case your existing portfolio was already assessed:
> Implement engagement strategies with investees based on their Impacts-Levels, using the Strategy Stress test (external)/Due Diligence
> Set integrated sustainability targets for the portfolio, i.e., a target informed by the NPIs of the individual portfolio companies
> Continuously update fund strategies using impacts, risk, opportunity and ambition to align with evolving sustainability standards while maintaining financial performance
> Implement integrated decision-making processes at the asset level by informing investment decisions and rebalancing the asset’s product/service portfolio based on both sustainability Impacts-Levels and financial KPIs in the PI® Strategy Matrix
> Monitoring: Track progress by comparing the expected Impacts-Levels to the achieved performance across your entire portfolio in the PI® Strategy Matrix while keeping track of the activities and actions initiated by you (in case you want to monitor and report your investor impacts)