On track to net positive? How companies create societal value
Paper No. 3 of the PI paper series “Demystifying the links between sustainability/ESG and performance”

The existence of companies depends on the value they can offer through their products and services. But companies can also erode or destroy value for themselves and society by generating negative impacts that impose costs on society and future generations.
The PI Societal Value Framework is introduced as an innovative approach to measure the societal value companies create or diminish holistically. It assesses the overall sustainability performance of organizations by netting financial baselines with monetized impacts on society (i.e., positive and negative externalities). The PI SV Framework consists of three KPIs: the Societal Value (SV), the Societal Earnings (SE), and the Societal Earnings Margin as the SE/SV ratio (SE Margin). Their novelty lies in avoiding impact washing (creative accounting of impacts, e.g., double counting of positives) and defining financial baselines that fit the value chain scope of the respective societal impacts. The conception of the PI Societal Value Framework avoids mixing absolute and marginal impacts and considers only absolute ones in its calculation. For this and other methodological reasons, only own operations and upstream value chain impacts were considered.
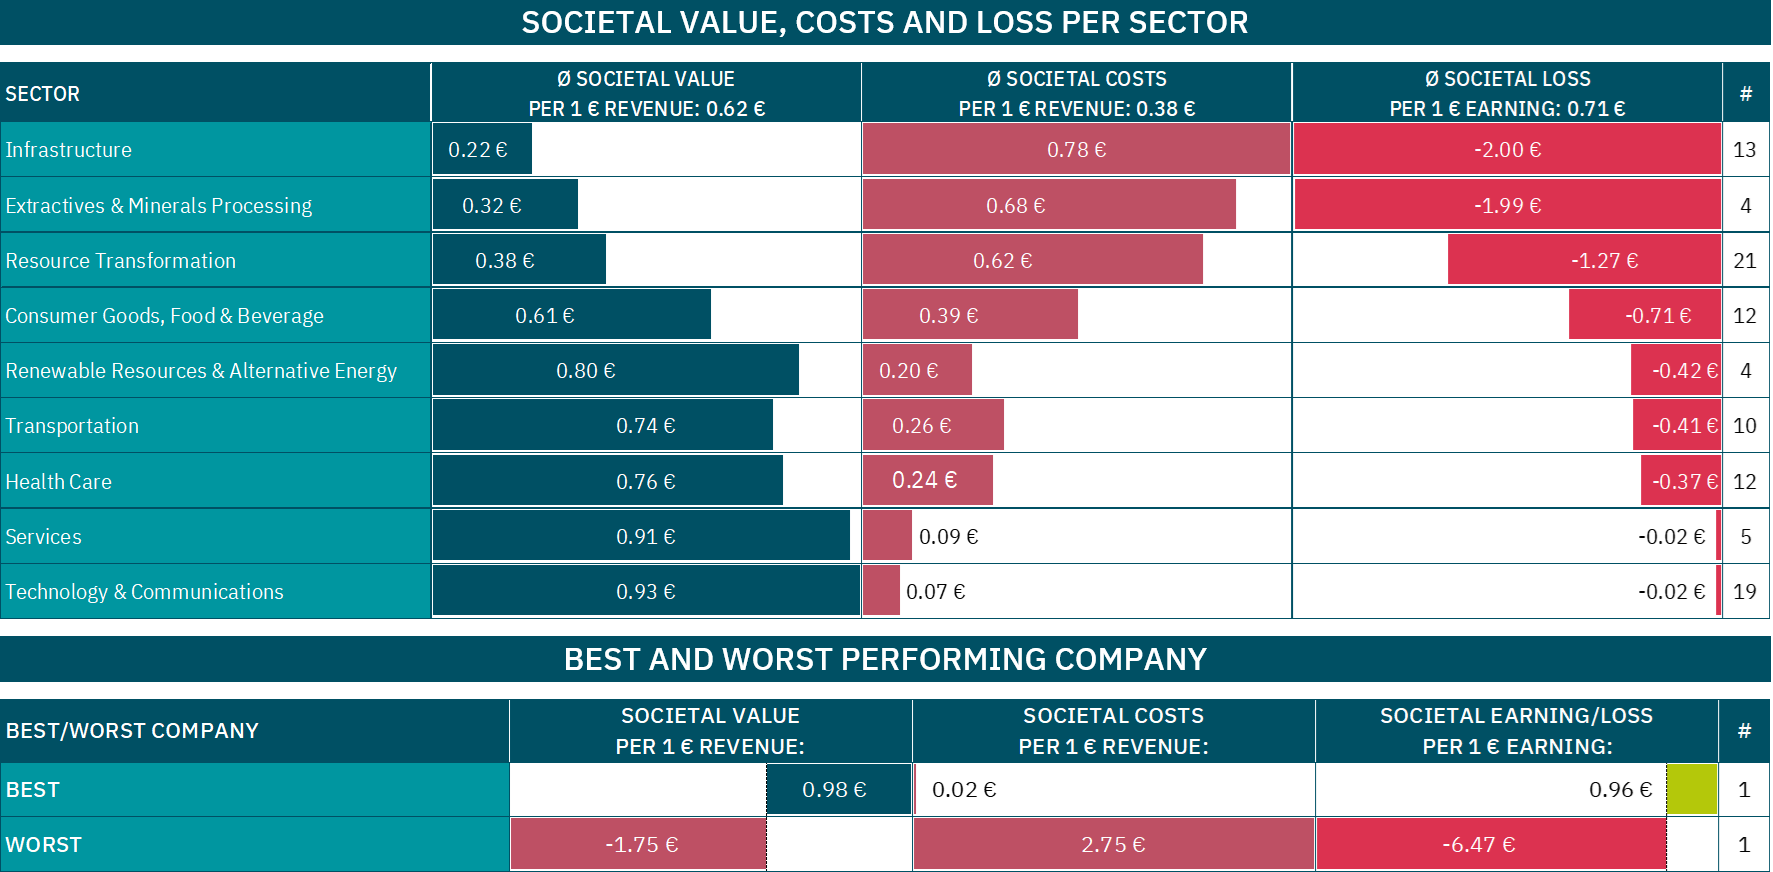
The proposed framework was empirically tested on the largest 100 companies listed on the German Stock Exchange classified according to the Sustainable Industry Classification System® from the IFRS for two subsequent years. On average, all companies created an SV of 62 Euro cents for each Euro revenue in 2019; the rest (38 Euro cents for one Euro in revenue) was eroded as Societal Costs. On the contrary, the average SE was -71 Euro cents for every Euro earned along the value chain, meaning they created a Societal Loss. However, 20 companies from various sectors generated Societal Earnings, as the taxes paid were higher than their externalities, i.e., they were net positive. The best company generated 96 Euro cents of Societal Earnings for each Euro earned along the value chain. The worst created a Societal Loss of 6.47 Euro for each Euro earned. Both companies came from the worst performing sector: Infrastructure.
© positive impacts (PI) GmbH (2022)
The study also shows significant differences among industry sectors. Ten companies in the Transportation sector together produced the highest absolute Societal Value, while the four Renewable Resources & Alternative Energy companies together produced the absolute smallest. However, on average, the former generates only 0.74 Euro SV per one Euro revenue, while the latter reaches 0.80 Euro per one Euro revenue. The worst positioned sectors are Infrastructure and Extractives & Minerals Processing which produced only around one-fifth to one-third of Societal Value for every Euro as revenue and 2 Euros of Societal Losses for every Euro earned along the value chain. On the other side, the Services and Technology & Communications sectors have the best Societal Value with 91 and 93 Euro cents per Euro revenue, respectively, generating the lower Societal Losses with only 2 cents for every Euro earned (see above).
For example, on average the upstream and direct externalities of the Infrastructure sector in 2019 was €9.3 billion. To calculate the SV, this number is added to the average revenue of this sector (about €11.8 billion), resulting in €2.5 billion SV or 0.22 € SV per 1 € revenue. To calculate the SE, the externalities are added to the average upstream and direct income taxes paid (€0.68 billion), resulting in € -8.6 billion SE or -2.00 if this number is divided by the upstream and direct earnings (€4.29 billion) of this sector.
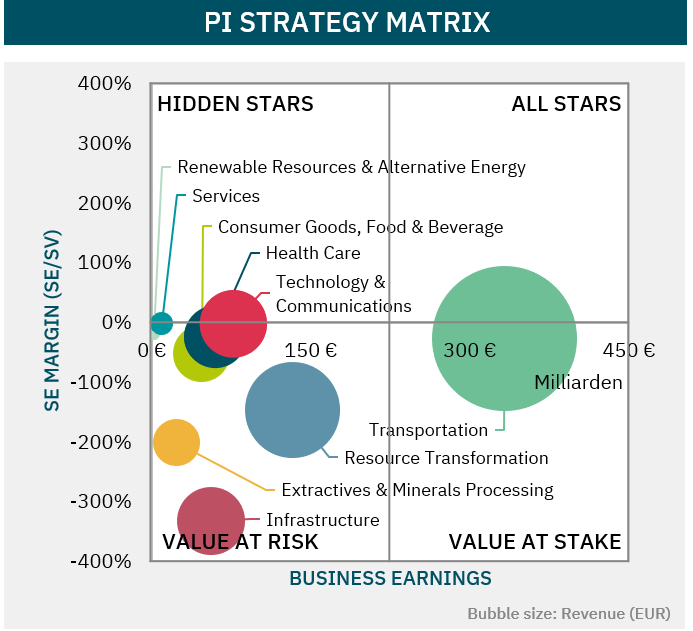
Complementarily, the PI Strategy Matrix was introduced to show the position of the sample sectors in PI’s “strategic quadrants” based on their Societal Earnings Margin and private earnings. (see below). Only the Transport sector was positioned between All Stars and Value at Stake. Four sectors were clearly located in the Value at Risk quadrant: Infrastructure, Extractives & Minerals Processing, Resource Transformation, Consumer Goods, Food & Beverage. The rest were positioned between Value at Risk and Hidden Stars. It was demonstrated that the PI Strategy Matrix can be used in scenario analysis to show how investment alternatives would move the portfolio to the upper right – enabling the integration of sustainability into investment evaluation and strategic planning.
© positive impacts (PI) GmbH (2022)
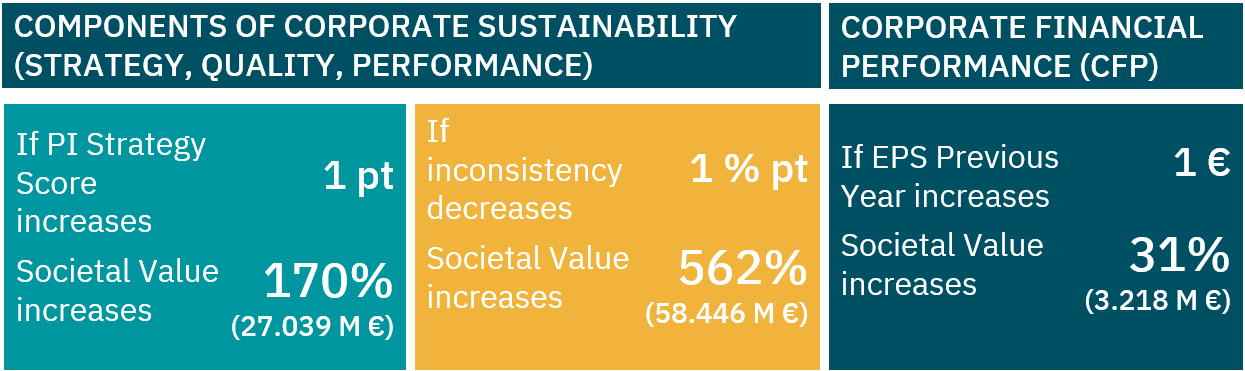
The previous results combined with the PI Ambition Level Concept show that SV, sustainability strategy, and management quality are positively related[1]. A statistical model proved that increasing the integration of sustainability in the business strategy (increasing ambition level) and improving management quality (increasing consistency) resulted, on average, in an increase in Societal Value of 170 % (27 billion Euros) and 562 % (58 billion Euros) respectively (sample range: -25 billion € to 155 billion €). The company’s financial performance measured as Earnings per Share of the previous year increased the Societal Value by only 31 %.
© positive impacts (PI) GmbH (2022)
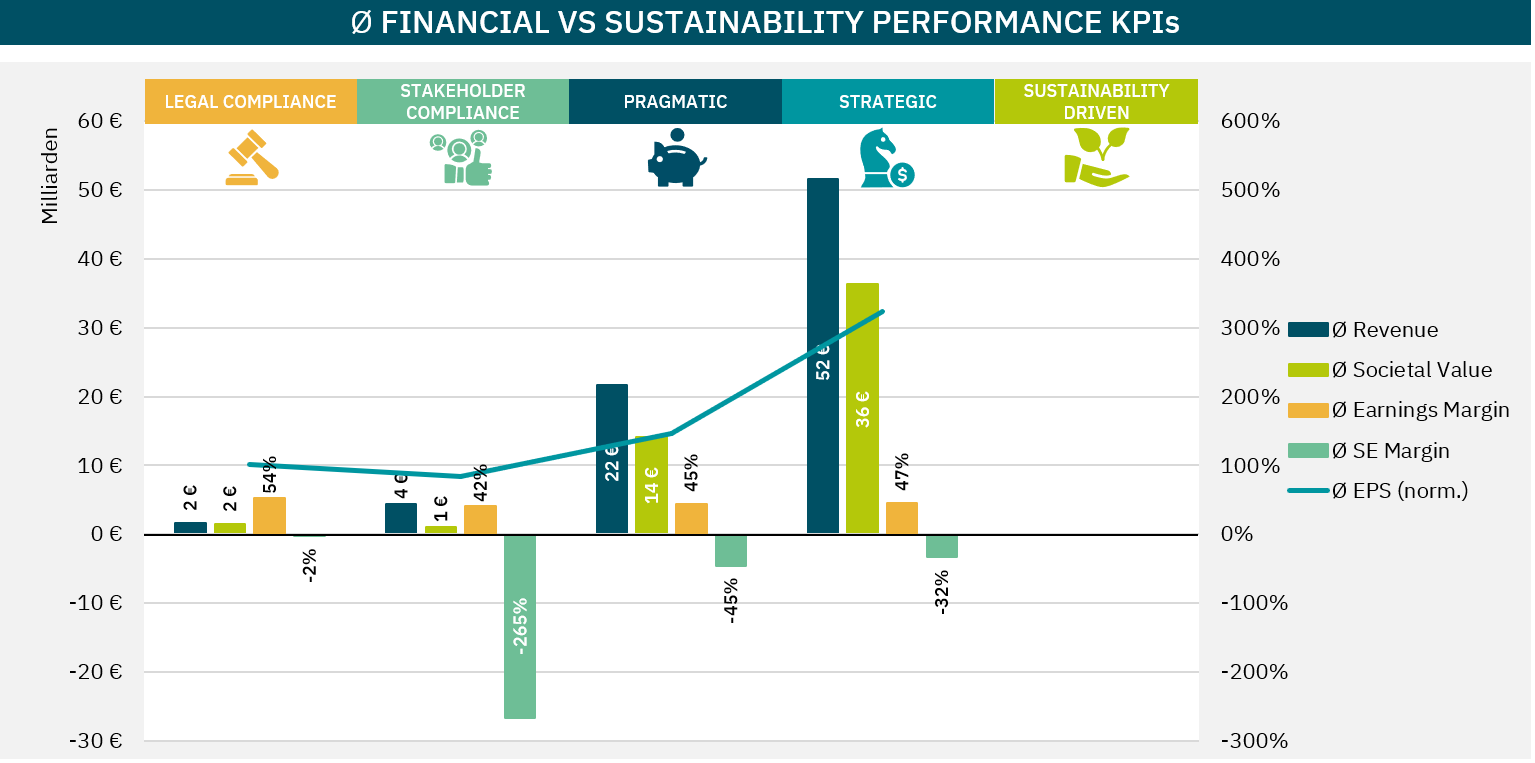
In summary, on average, companies with higher ambition levels and more consistent management approaches presented significantly higher revenues, higher profits (EPS), higher Societal Value, lower negative Societal Earnings Margins, and even slightly higher private Earnings Margins. These results indicate that a management approach that is ambitious and consistent create a double dividend: value for society and the shareholders. However, ultimately, a positive SE Margin should be the goal next to a related positive Societal Value, as 20 companies in the sample were able to achieve.
© positive impacts (PI) GmbH (2022)
The PI Societal Value Framework improves transparency on the impacts of economic activities and is feasible to be integrated into an organizations’ strategic planning. It allows understanding and measuring the multiple factors behind productive activities, identifying to what extent they are sustainable. The identification, measurement and comparison of the underlying factors should determine the level of sustainability. Binary views on sustainability performance (it is or is not) and management will cost society its most precious resource: time.
The underlying work was supported by B.A.U.M. e.V., and by the former Value Reporting Foundation (VRF, now consolidated with the IFRS Foundation in support of the International Sustainability Standards Board, ISSB) and the Institutional Shareholder Services group (ISS ESG) with free research licenses and data.
Fill out the form to receive a free download link to our paper !